SWAT CAM Maps
Each map that is generated is based on the value determined in each individual image represented in that operation date that is then extrapolated across the field to give you your map layer.
Crop Coverage - The Crop Coverage map is created by analyzing the percentage of crop coverage observed in the field images. This map provides valuable information about the extent of crop growth across the entire field.
Weed Coverage - The Weed Coverage map is generated based on the percentage of area covered by weeds. It is calculated by subtracting the crop coverage from the vegetation coverage for each image providing you with a visualization of weed distribution in your field.
Kochia - The Kochia map displays the percentage of Kochia coverage across the entire field. It provides valuable information about the extent of Kochia presence in your crops.
Vegetation - This map will detect and capture all types of vegetation present in the image.
Bare Soil - The Bare Soil map provides a visual representation of the amount of visible soil in the images, expressed as a percentage of the total area.
Plant Per Foot - The "Plant Per Foot" map provides a visual representation of the number of plants per square foot in a specific area. This information can help you assess if you are meeting your planned targets or if there are areas that require further investigation and targeted agronomy practices.
Plants Per Acres -This map provides a visual representation of the number of plants per acre in a specific area. It can be used to determine if you are meeting your planned targets or if there are areas that require further investigation and targeted agronomy.
Plant Spacing - This map provides an average calculation of the distance between plants within the images.
Note: The machine learning algorithms are constantly being reviewed and improved. If you feel there is a discrepancy or the maps are inaccurate, please contact support@swatmaps.com.
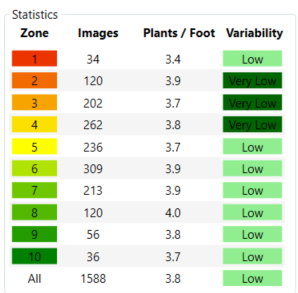
Statistics Window
Now located in the "Maps" tab
Images - Number of images captured in all of the representative zones.
% Cover, Plant/Ft², Plants/Ac- The average value is calculated based on the selected map (the header title will change automatically) for each zone.
Variability - Variability is an indication of the level of variation in the selected map. For example, if you have a "Low" variability within a zone (Crop map), it means that there is very little variation in crop coverage within that specific zone. This information can help you understand the consistency in different areas of the field.